Agent Movement Using User Drawn Vectors – Example 11.3
This last example of using Agents steered by a static vector field continues the logic started in Example 11.1 and further developed in Example 11.2. In those examples, we used a rather consistent Vector Field with vectors generated by Grasshopper itself to steer the agents. There is no reason, however, why you cannot set the vectors yourself, drawing them in Rhino, and using these to steer the Agents. This requires a bit more artistic interpretation, but it also gives you more control over the process…if you are smart about it.
Here we will be using the same looping process as before, so if you haven’t done it yet, you will need to refer back to Example 11.1 and have that script ready to adapt to this example.
Step One – Draw Lines to Set Vectors in Rhino
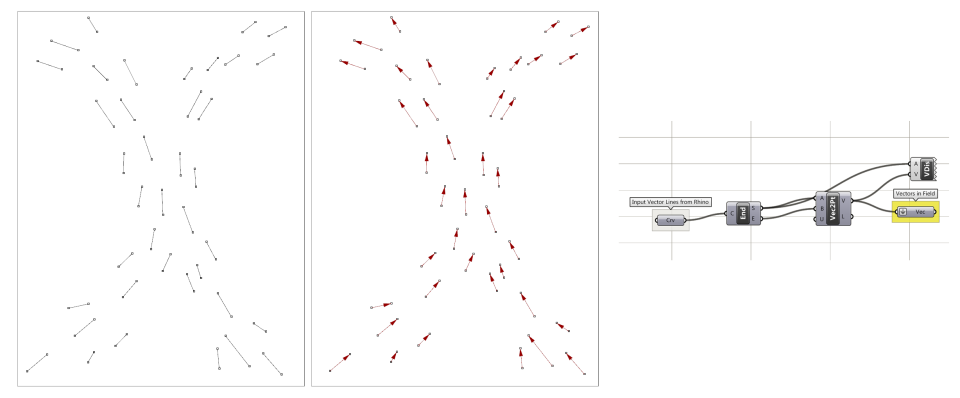 We start out by drawing a closed curve as a project boundary. We also draw simple line segments to indicate how movement is happening across a surface. Pay attention to the direction in which you draw these lines. The vectors will “Start” at one end and “End” at another. If you later want to switch the direction of the vector, you can select the line in Rhino, and use the “Flip” command to change the line direction. We then reference these lines into Grasshopper, and using the “Endpoints” component and the “Vector 2pt” component, set our vectors. The start points (the vector anchor points) and the Vectors themselves will be plugged into the appropriate place in the script we developed in Example 11.1
Step Two – Establish the Starting Points
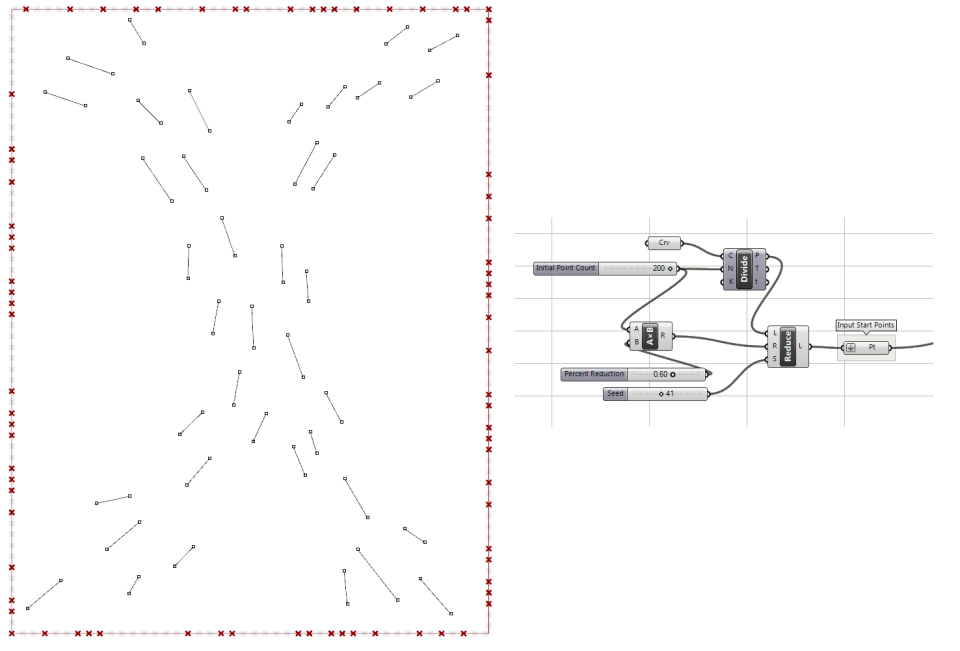
In the previous examples, our starting points were a random cloud of points on the surface. Here I want each line to start at an edge of the project, and to go on a journey until it leaves the project surface again. In this particular case, I selected the edge curve and divided it evenly into many points, and then used “Random Reduce” to get rid of a percentage of these points (in this case 60%).
Step Three – Modifying the Vector Inertia
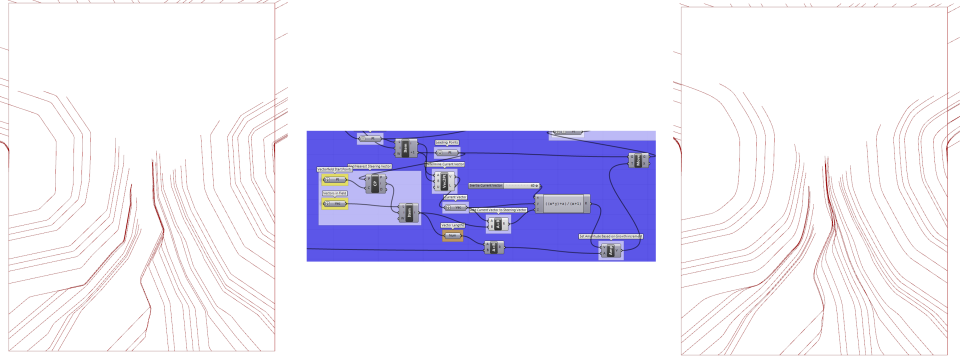
With the vectors, the vector anchor points, and the “Field Line” starting points, I am ready to start looping. Since our vector field is not very dense, when a growing line takes a vector from a new closest point, the change in direction is rather abrupt (Image left). If I want to soften this angle, a simple formula can give more weight to the current heading of a line vs. the new steering vector. You will see here I made a formula with the “Expression” tool that the new vector = (Factor x Current Vector + New Steering Vector). Here I have a factor of 40. You will see that the turning angles (Image Right) are softened considerably after this modification.
Step Five – Modifying the starting Vector
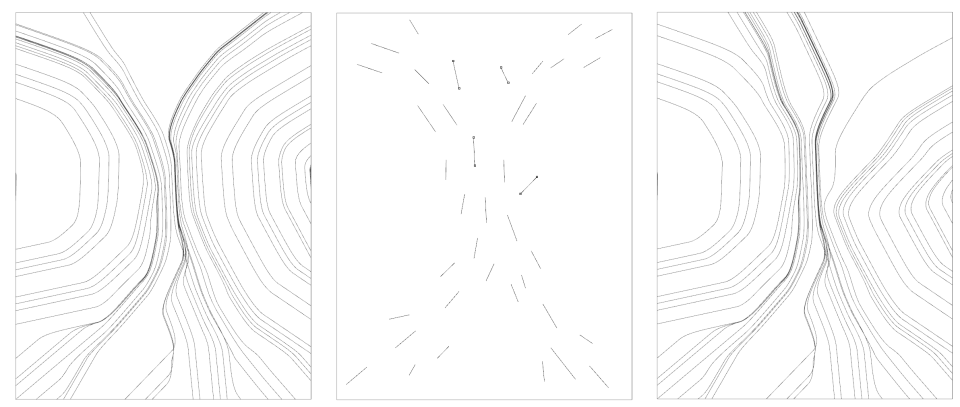
While not 100% necessary, after you generate your field lines, you may not be happy with the results, or may see some opportunities to improve it. This can be done by gradually modifying the endpoints of the lines you drew in Rhino, adding new vector lines, or taking some away. Here I modified just 4 of the original lines, and you will see how the Agent paths changed. Note that every time you modify anything in the starting conditions before the loop, the loop will reset and regenerate.
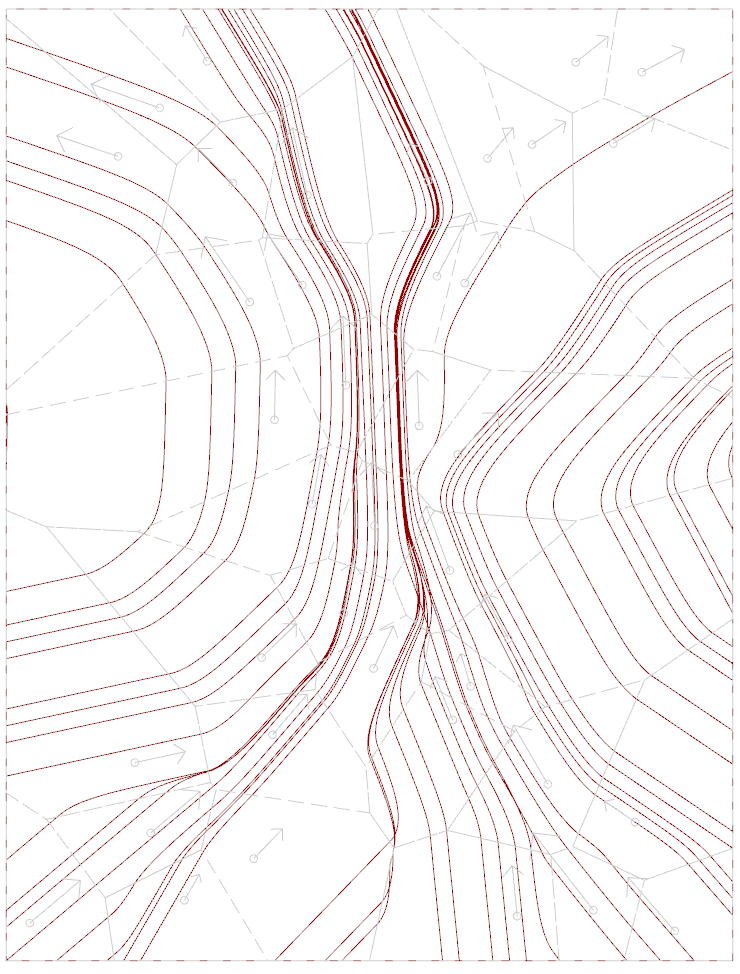
Voronoi diagram underlaid under the field lines, showing the regions of influence for each anchor point, with its associated vector.
One last thing. You may find it helpful to add a Voronoi diagram to your vector anchor points so you know exactly the region of influence for a particular vector. The closest point may not always be obvious, but the Voronoi will make this clear. You will notice when the growing lines pass from one Voronoi cell into another they start aligning to the new vector.
Variations
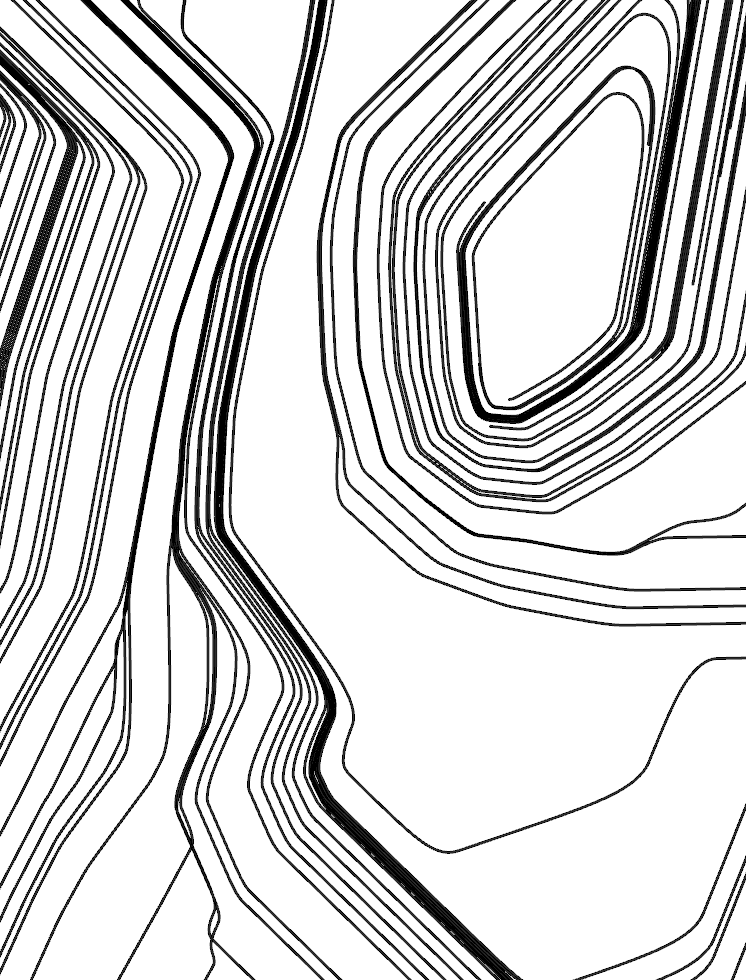
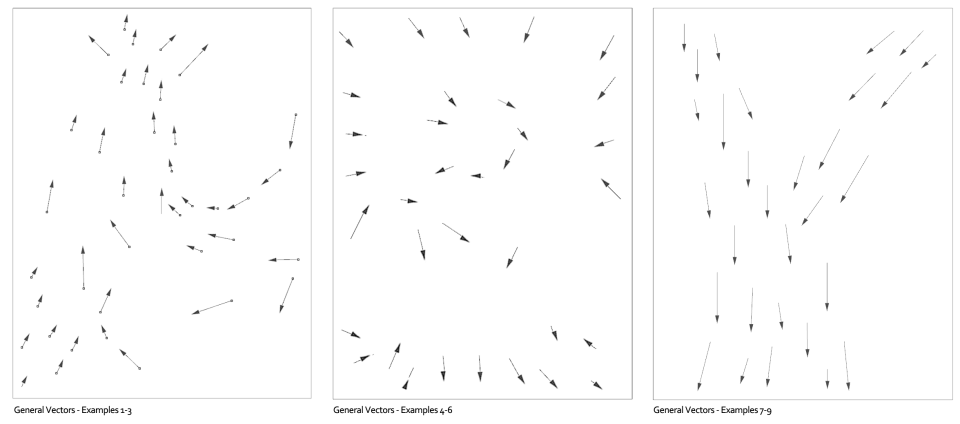
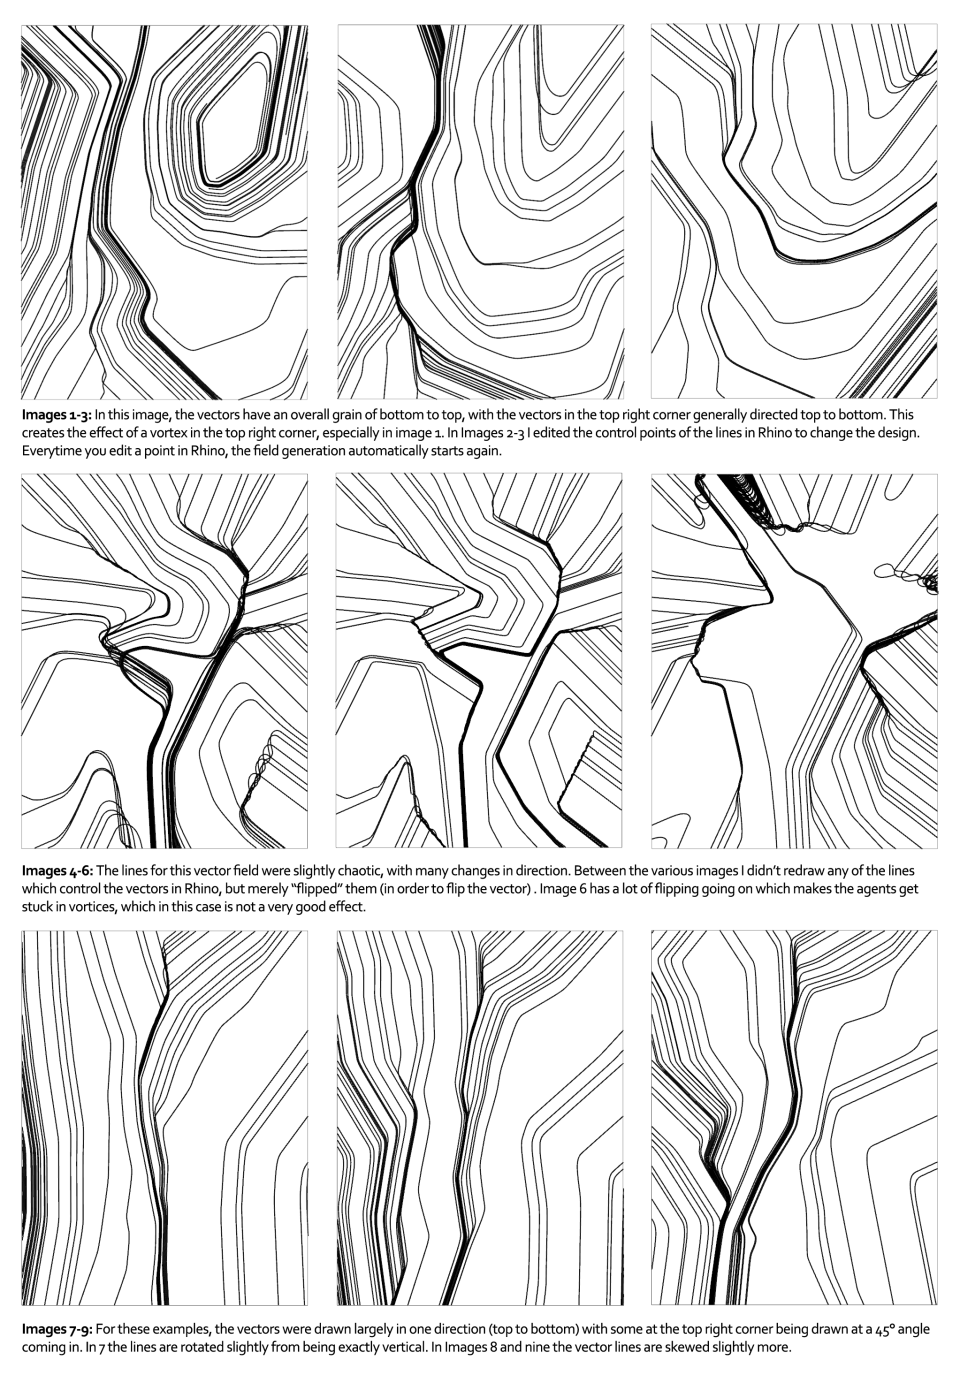
For the following variations I used three starting vector fields, and then made minor variations to the lines, along with their inertias: The variations are explained in the image text.
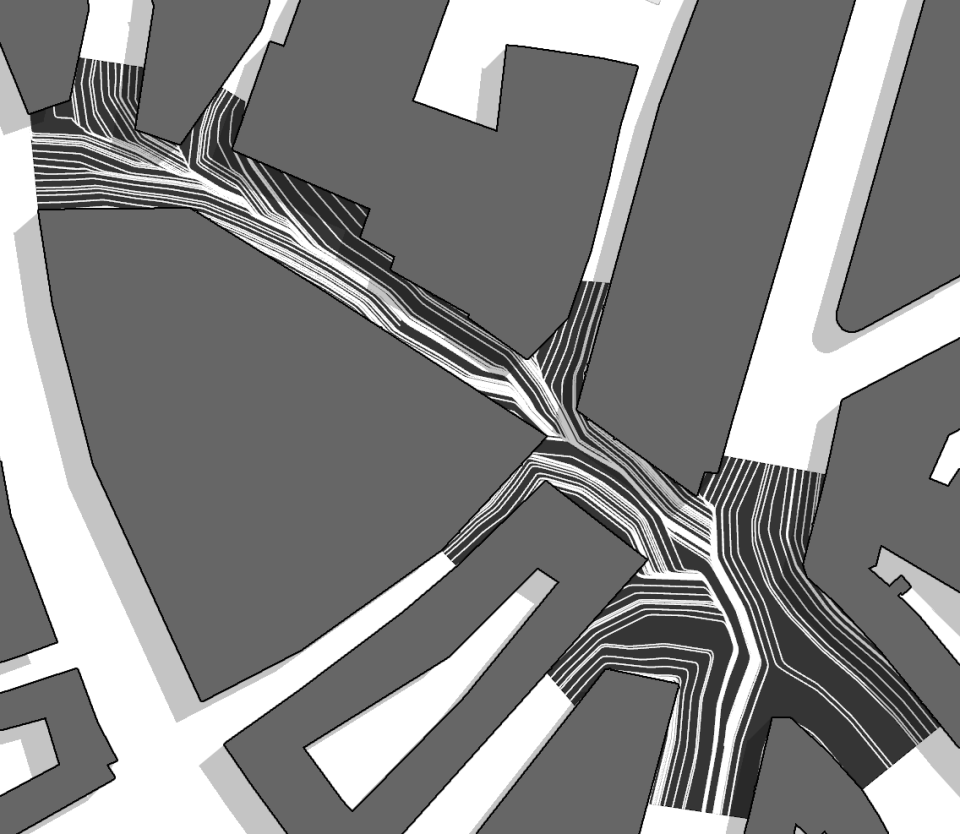
This is something that can be easily and practically adapted to a “real” project. In the image below, I was looking at a Pedestrian Zone in the city of Hannover and speculating on a potential pattern. I just sketched in vectors, and used the boundary curve to generate vectors on a regular basis, and used a second set of curves in each street to generate more. This design could be more intelligently done by watching how people actually move in and out of the space, and setting densities of starting lines based on how many people pass by a point in a given time frame. Hopefully the idea is clear though.
very nice work! i followed your examples and wonder why mine has only got very few result field lines? My script seems to omit most of the starting points.
LikeLike
Check to see if you have enough points on the edge from Step 02. Either you need to divide your edge rectangular with more points or cull fewer of them. The other possibility is you didn’t loop the script long enough?
LikeLike
Great job! I am having a very hard time to set this script. It seems like I am missing something but I can’t figure out what is it. Would you send me your definition or could I send you mine? Thanks!
LikeLike
Great work ! I love the results, it reminds me of Pablo Palazuelo’s paintings.
LikeLike
Great example but does anyone have whole script of this definition I have some doubts?
LikeLike